|
Digital
History>eXplorations
Public
Opinion and the Vietnam War
Drawing on
the following charts and graphs, construct an explanation for
changing American views toward the Vietnam War.
You may wish
to use timelines for the Vietnam War for reference: (External Links)
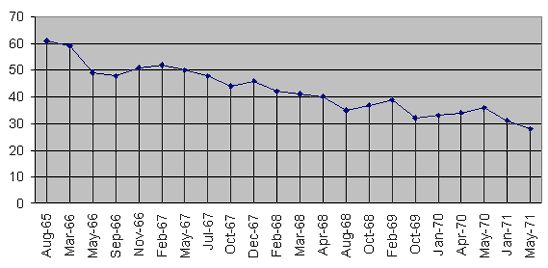
SUPPORT FOR THE WAR AS MEASURED BY "NO" RESPONSES TO
THE MISTAKE QUESTION ASKED:
"In view of developments since we entered the fighting in Vietnam,
do you think the U.S. made a mistake sending troops to fight
in Vietnam?" (Gallup)
DATE |
PERCENT
WHO SAID NO |
| August
1965 |
61 |
| March
1966 |
59 |
| May
1966 |
49 |
| September
1966 |
48 |
| November
1966 |
51 |
| February
1967 |
52 |
| May
1967 |
50 |
| July
1967 |
48 |
| October
1967 |
44 |
| December
1967 |
46 |
| February
1968 |
42 |
| March
1968 |
41 |
| April
1968 |
40 |
| August
1968 |
35 |
| October
1968 |
37 |
| February
1969 |
39 |
| October
1969 |
32 |
| January
1970 |
33 |
| April
1970 |
34 |
| May
1970 |
36 |
| January
1971 |
31 |
| May
1971 |
28 |

Indicator
Pre-TET Post-TET Change
| Indicator |
Pre-TET |
Post-TET |
Change |
| Approves
Johnson's handling of job as president |
48% |
36% |
-12 |
| Approves
Johnson's handling of Vietnam |
39% |
26% |
-13 |
| Regards
war in Vietnam as a mistake |
45% |
49% |
+4 |
| Proportion
classifying themselves as "hawks" |
60% |
41% |
-19 |
Source: The Gallup Poll: Public Opinion 1935–1971, by George
H. Gallup
See http://faculty.smu.edu/dsimon/Change-Viet2.html for more charts.
|
